
Alida Metcalf, Chair of Rice University’s History Department, introduces her students to images and artifacts available through the new historical atlas, imagineRio, found online at http://hrc.rice.edu/imagineRio/.
“I’m a historian of one of the most fascinating countries of the world, and one that is very interesting to Americans because of its similarity to our own history,” begins Alida Metcalf, Chair of Rice University’s History Department, as she explains her fascination with Brazil. “When you study any other country, you find out a lot about yourself and Brazil especially makes for a very compelling comparison. Most Americans are unaware of the similarities between the two countries.”
The Architect and the Historian
Metcalf first presented at Rice in 2008, when she was recruited to give a job talk about her work on 16th century maps of Brazil. Farès el-Dahdah, then a Rice University School of Architecture Professor, was in the audience and they began an email correspondence after the lecture. Rice pursued Metcalf to fill an opening for a Brazilian historian, and when she returned to the campus in 2009, she and el-Dahdah met for lunch. “He was interested in the design of Brazil, and I was talking about my interest in and learning about digital mapping, how GIS is transforming the way we make maps. I’d started going to conferences on digital mapping, and I was learning how to make maps in GIS to be published in a book I was finishing.”
Originally, Metcalf and el-Dahdah planned an exhibit on Rio to go along with the excitement about the Olympics, but then it became a digital project. “Having an architect and a historian working on the same project allows you to come at it from different perspectives and sometimes we agree and sometimes we disagree on points,” said Metcalf. “But we can do so much more on a digital platform. Farès was interested in the design of the city from an architect’s perspective. I was interested in the social history of the city. He is a natural with digital technology. I was full of excitement when I returned from an International Cartographic Association conference on Digital Approaches to Cartographic Heritage in The Hague in 2011.” At that particular conference, there were a lot of librarians and archivists who had maps from all over Europe. How could they take those resources and digitize them, make them available to general public? “I saw how you could take a historical map and georeference it over a modern set of geographical coordinates so that the information on the map corresponds exactly to modern map coordinates. As Farès and I talked more, we quickly dropped the idea of an exhibit and went ‘digital’ and began planning a course on Rio that we could teach together.”
Digital Mapping and Teaching the History of Rio
Metcalf and el-Dahdah have taught the History of Rio HIST/ARCH 366 class three times. “We were really putting together the history of the city. We alternated lectures. Farès would focus on how the city’s urban fabric changed over time, the sorts of projects mayors and viceroys were implementing to redesign the city. What kinds of projects are architects developing to support the changing political aspirations for Rio? And I was teaching the social history of the city. Where did people live and how did they move through the city? How are the public spaces of the city used by the people?” 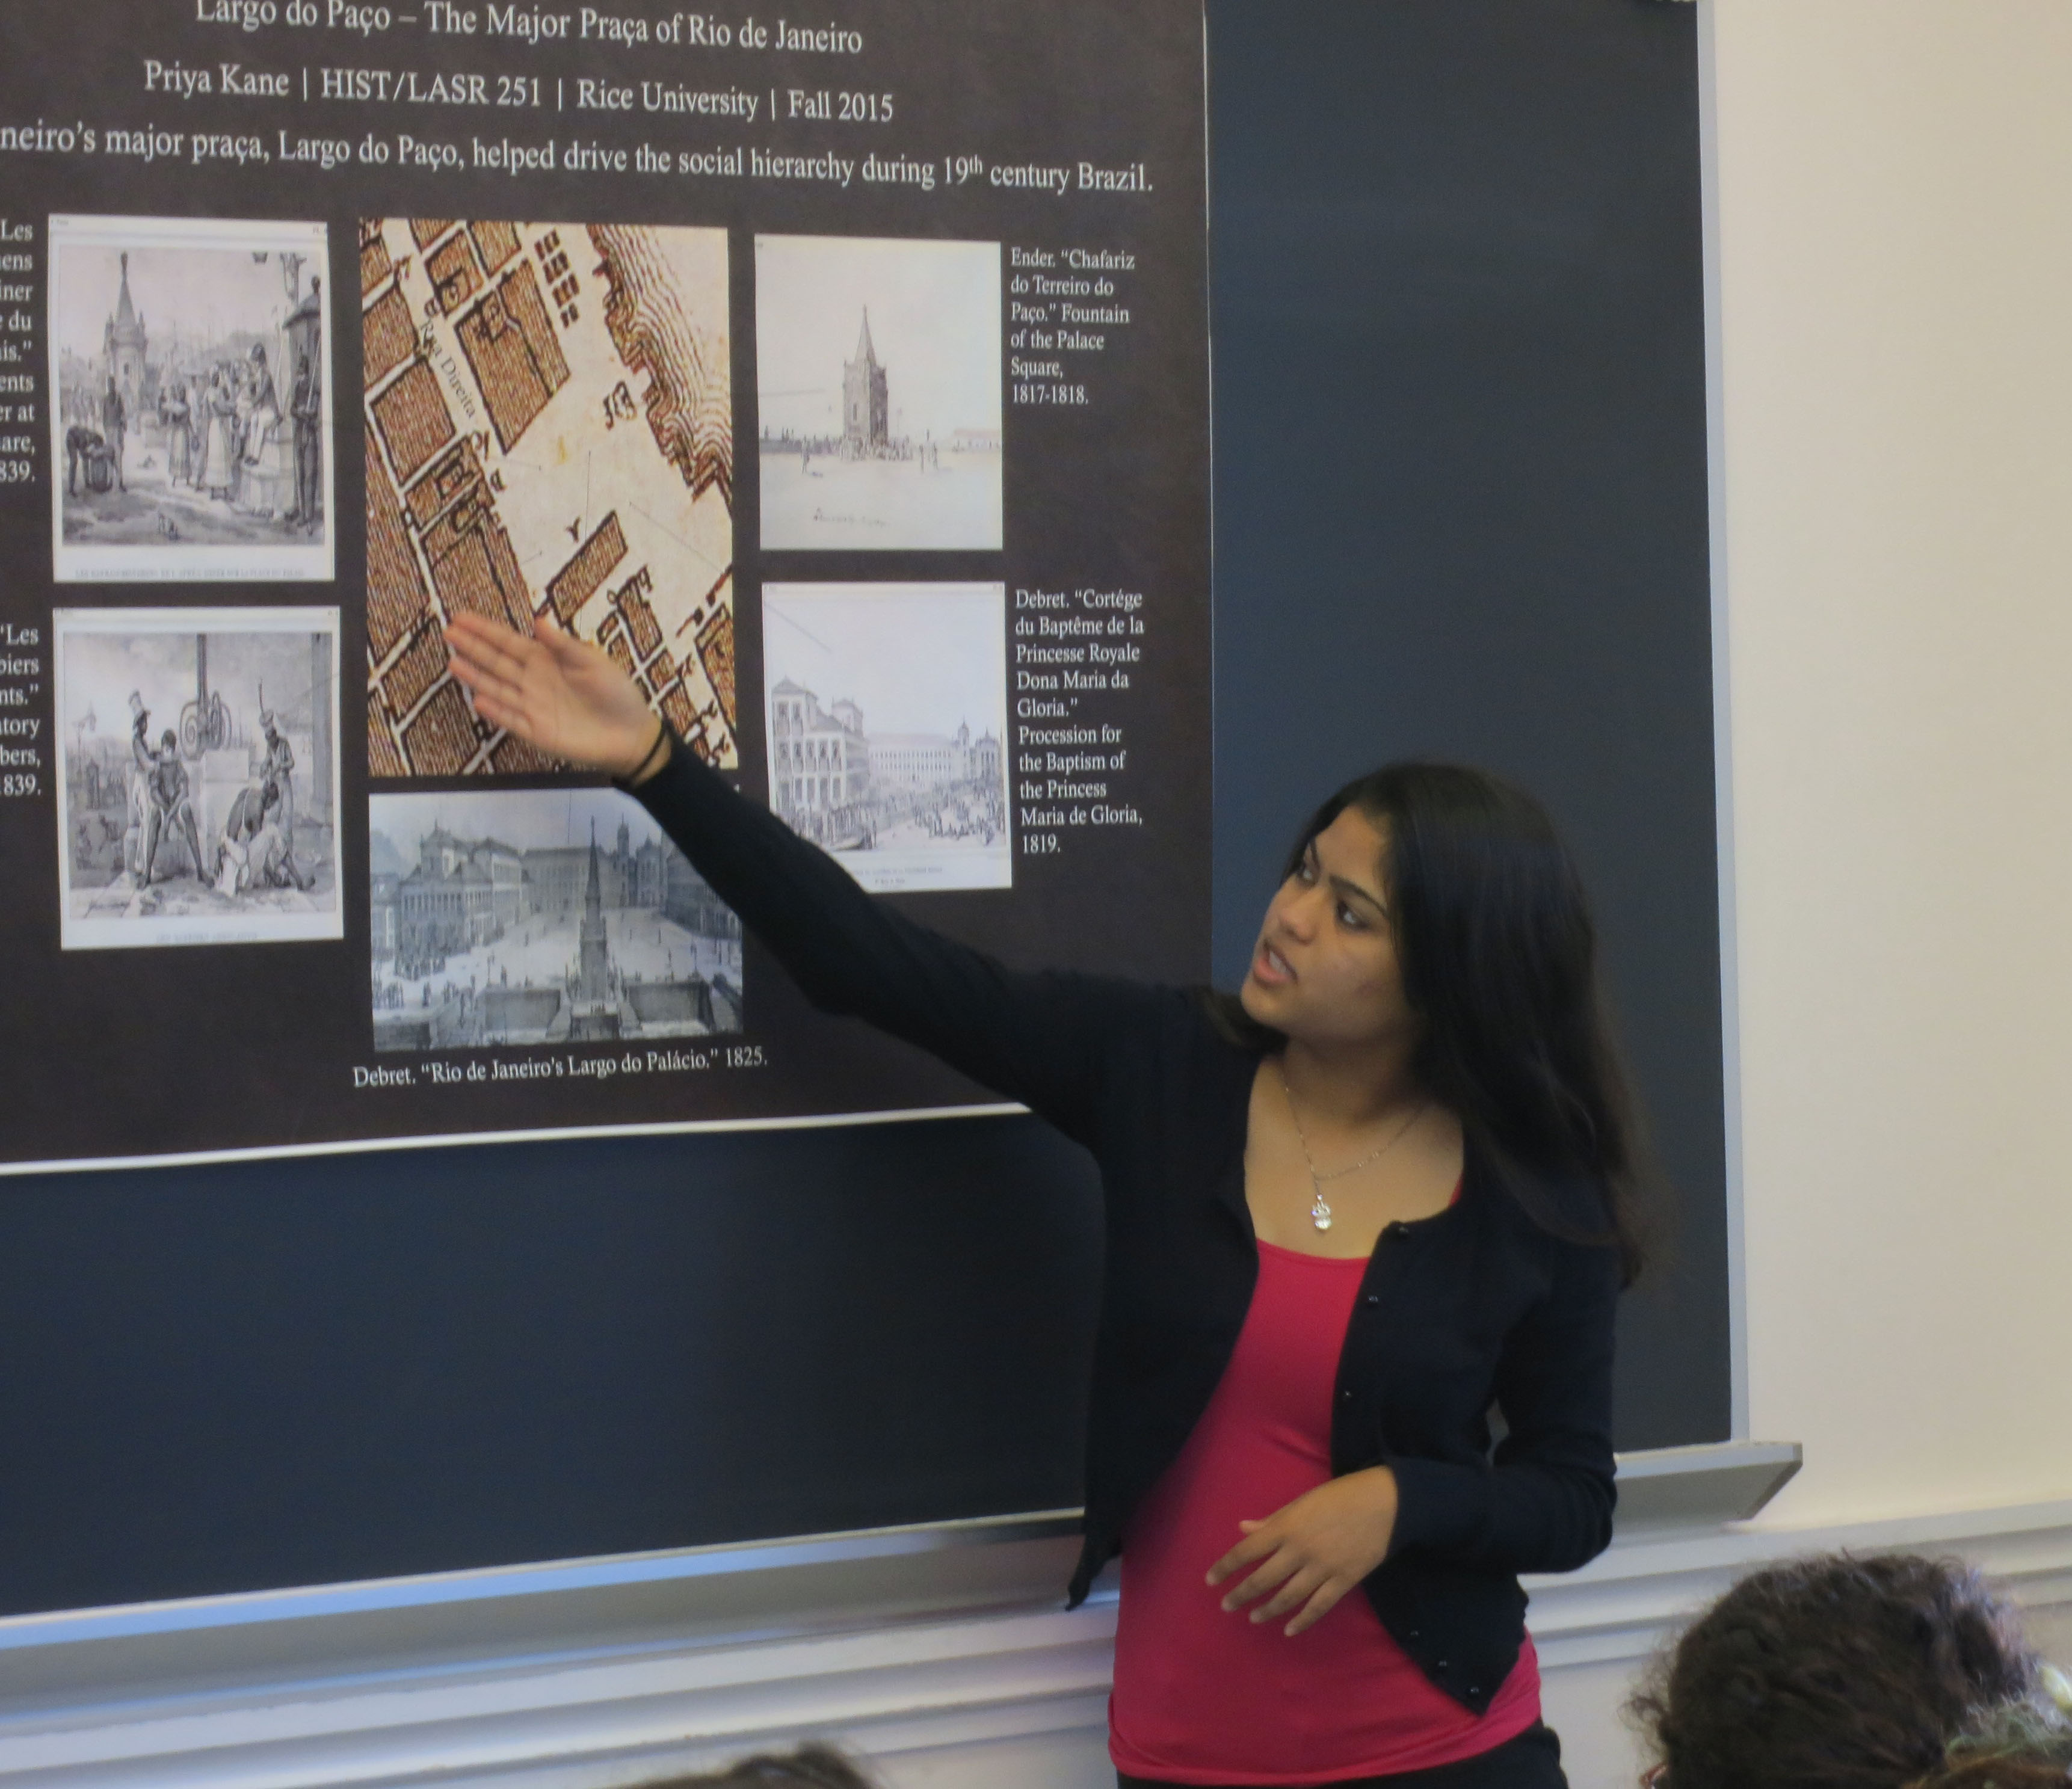 Both professors poured their respective energies into the course, sometimes spending 11 hours to develop a single lecture! “It was brand new,” said Metcalf, “From A.D. 1500 to the present, alternating lectures, incorporating discussions and readings and projects. And we were starting to build the imagineRio project at the same time. The more we accomplished in our research, the more we could bring to the class. We improved the class each time, and all along we were building the imagineRio web project. This semester, I was actually able to use the beta version of imagineRio in my HIST/LASR 251 class, “Brazil: Continuity & Change,” co-taught with Leonora Souza Paula.
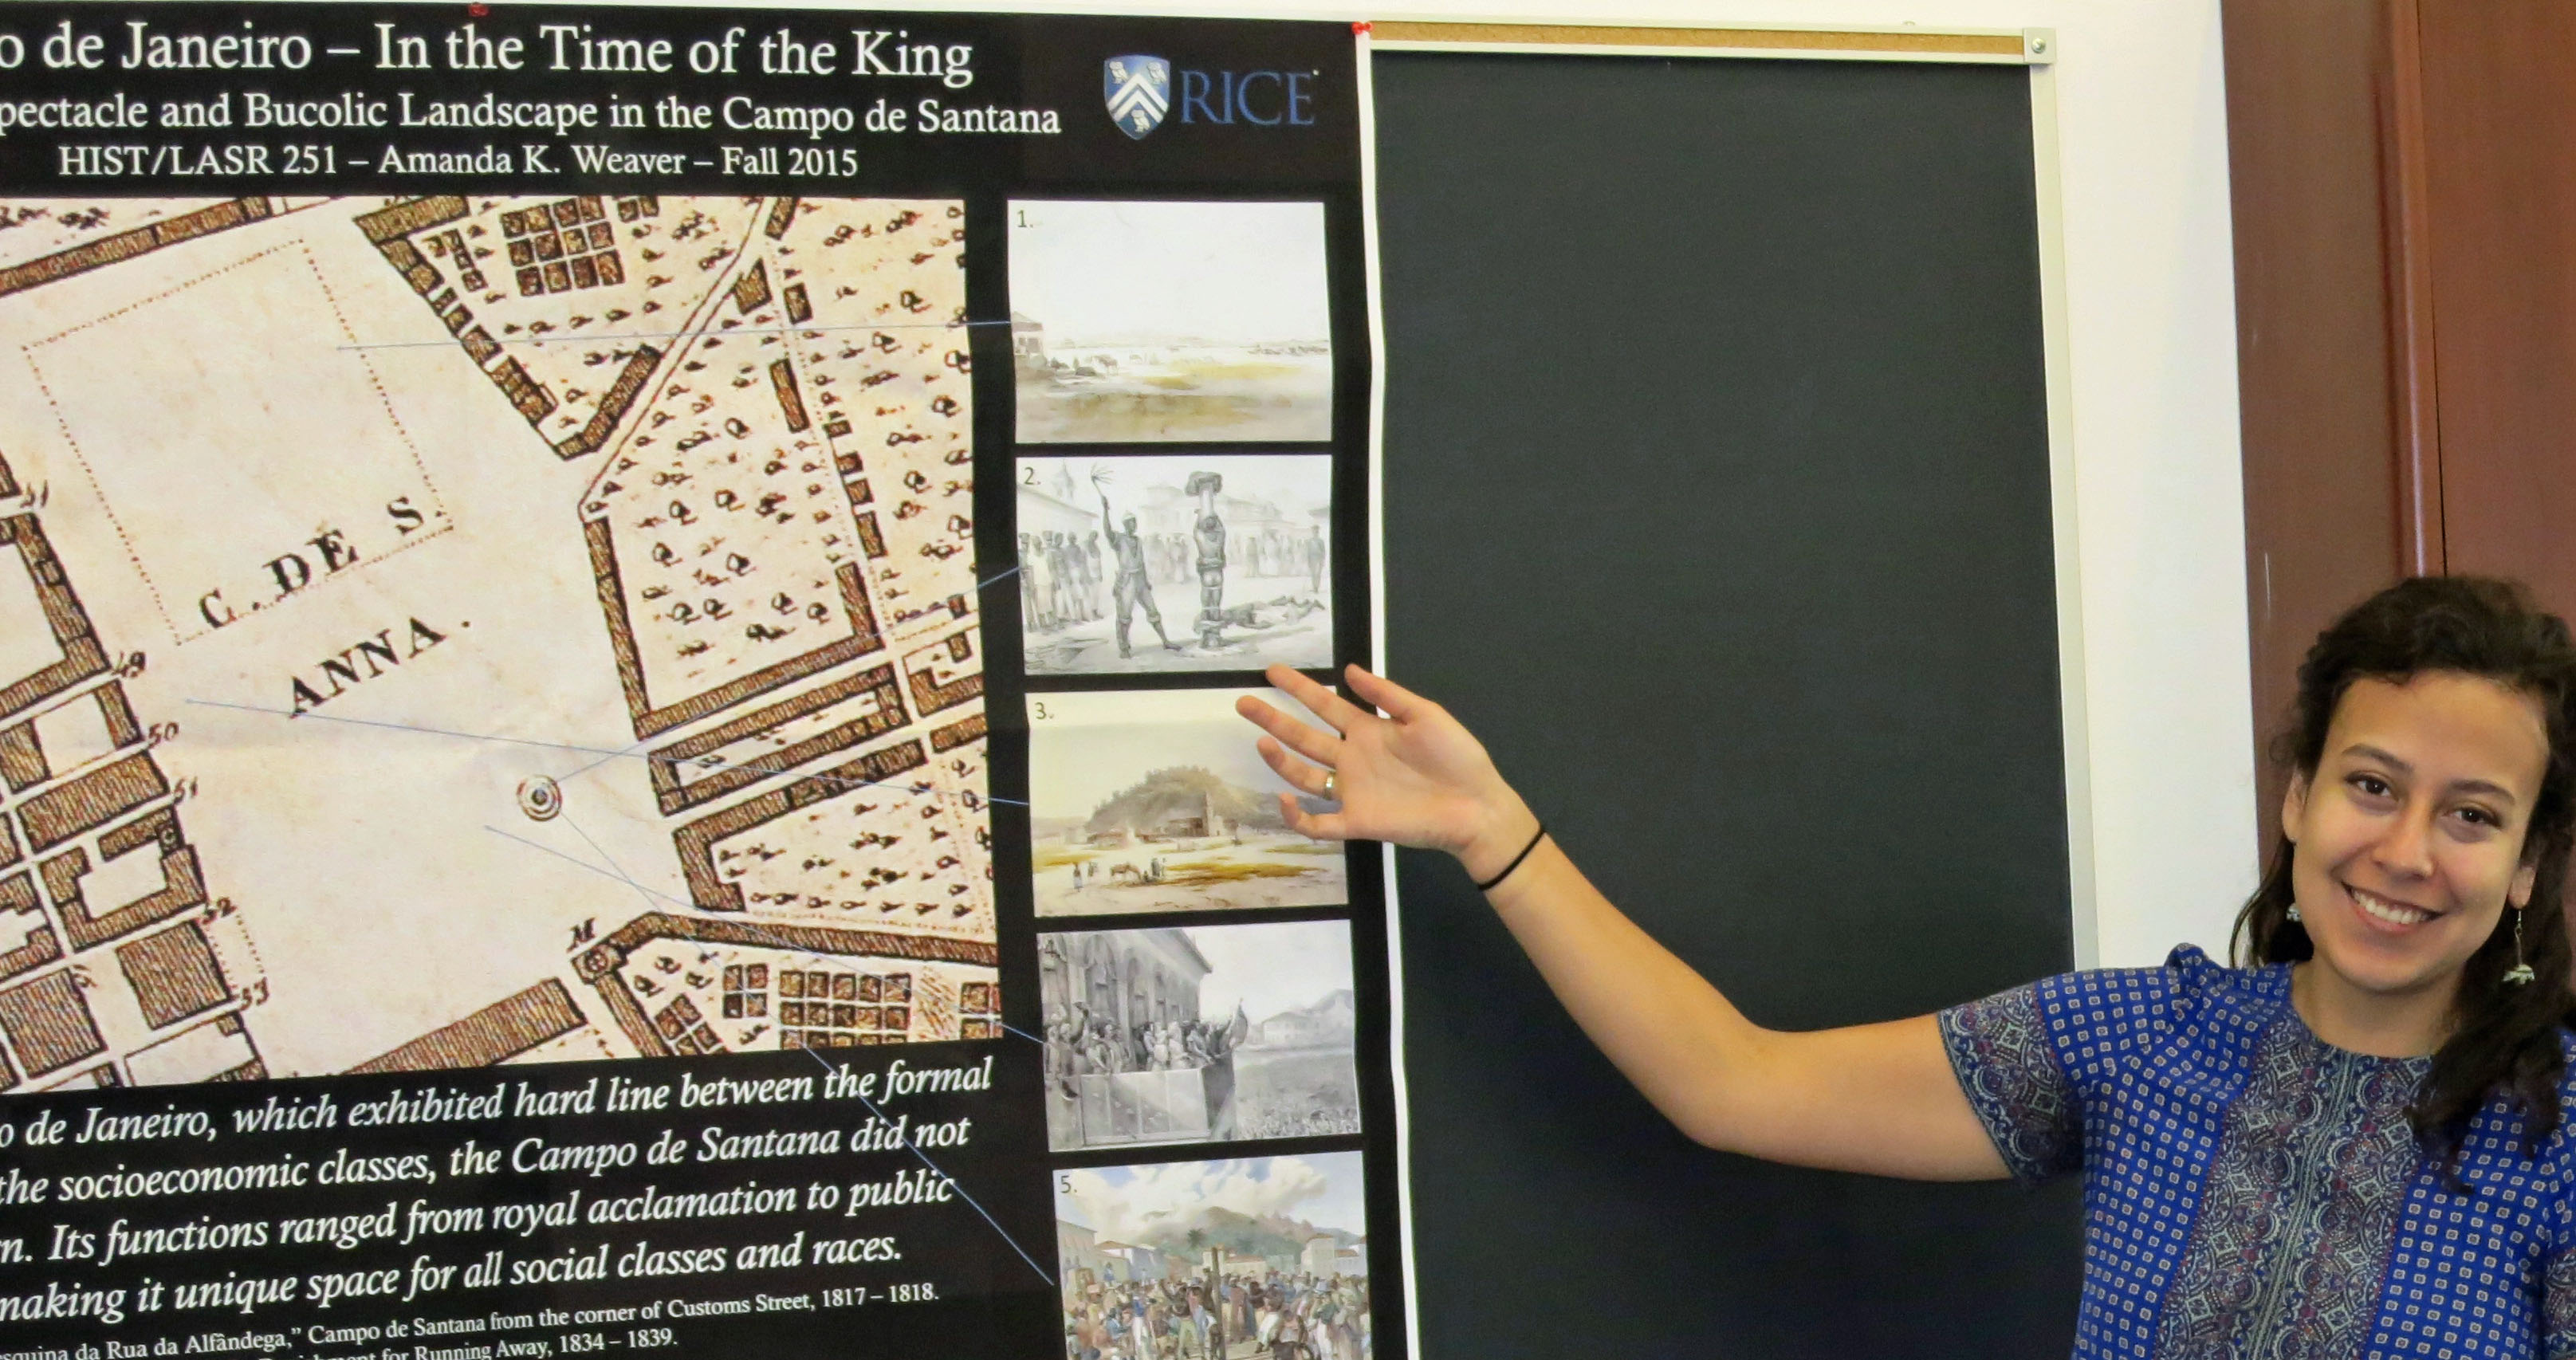
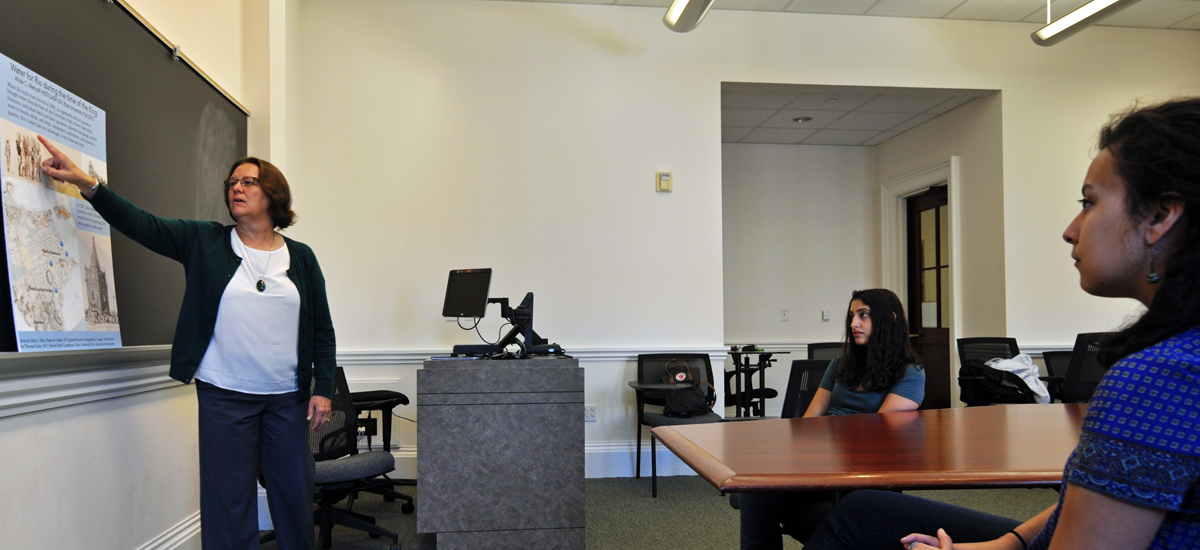
The instructors assigned a reading, “Memoirs of a Militia Sergeant,” set during the time of the king, when the king of Portugal fled Napoleon and lived in Brazil. Metcalf picked up the story, “Various artists arrived in Rio after the king made his court there, and they painted pictures of the city. Our Rice students had access to the images we had collected for the imagineRio mapping project. Their job was to pick a theme and, using the resources of imagineRio, develop a poster and a three-page paper. It is an ideal assignment, any university class anywhere can do this particular project,” said Metcalf. “I would say read this novel, here are the images, here’s how you access the images, and how you access the maps. American students can’t always easily do research on Brazil due to the language barrier, so this is a way for selected resources to be available and yet require them to do research and pick their own topics, to follow some story that interests them.”
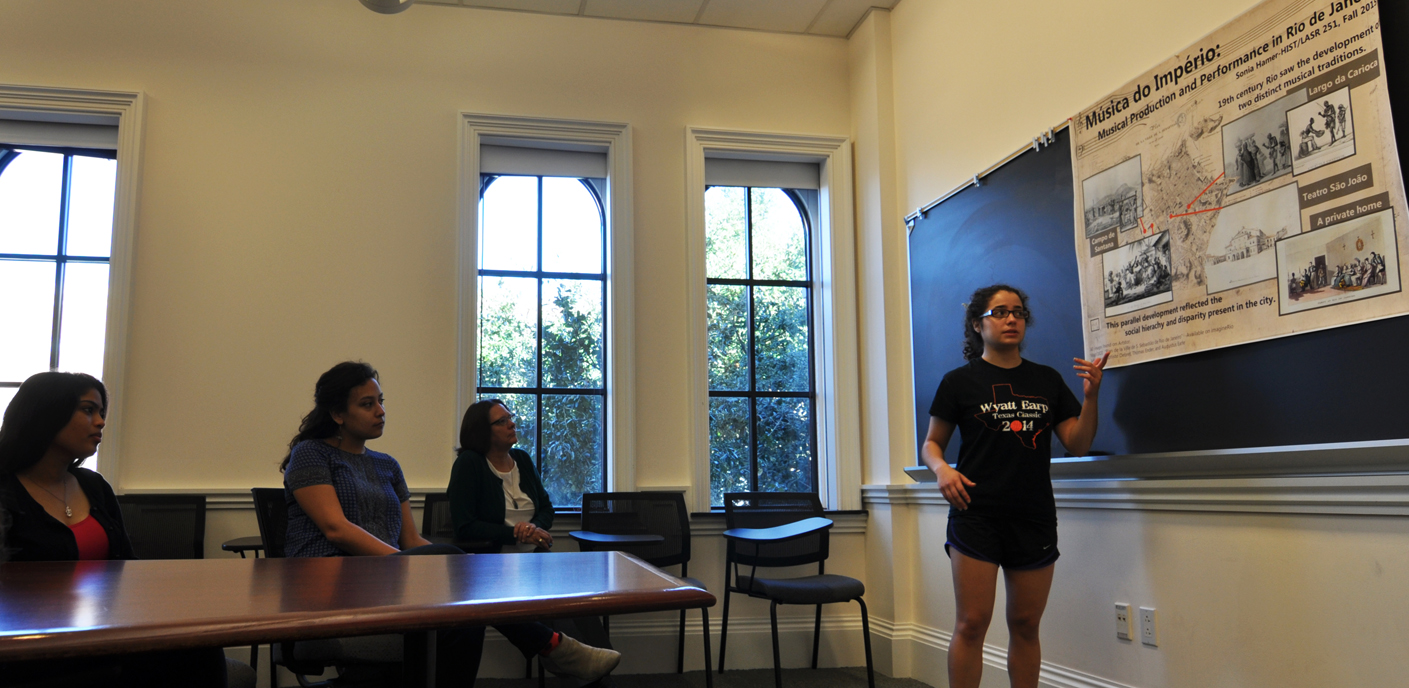 In November, the class wrapped up their poster and paper assignment and one in particular caught Metcalf’s interest. “One student had created a project around music and she was showing that what was happening in the city depends on class and location in the city. She made the case, with appropriate sources, that the elite music was inspired by European sources and found inside the music halls, homes and other buildings. But outside, you’d hear a whole different kind of music, based on African rhythms. Now there was nothing in our imagineRio project on music other than images of people playing instruments. And she decided to show on her map where these resources led, mapped them in city, and linked them to other musical resources.”
Different Platforms for a Sense of Time Travel
Rice has a license to ArcGIS and a GIS lab, so that’s where Metcalf and el-Dahdah began. “First, we developed a map of the city. We didn’t want just any old map of the city, but one that showed how it changed over time,” explained Metcalf. “For example, in 1502, there was no city. Then we collected historical maps. I went to the Library of Congress and got high resolution (high-res) copies of all their maps of Rio. We found other high-res maps of Brazil in the Biblioteca Nacional of Brazil as well. These must be georeferenced – you put the map in ArcMap and use a tool called geo-referencing where you add another layer and pin your map at different points. We always used the intersections of streets because they don’t usually change over time. Then you can look at your historical map and see where you are in real time.”
Then Metcalf and el-Dahdah collected images of the city made by visiting artists. “Every image that we could geolocate, we geolocated. The image is positioned its actual space, how the artists saw the views from where they were standing. On our site, you can see the map of Rio and click on that spot and see what the space looked like in 1817 or whatever time period. To bring all the resources together required different technology platforms, including ARTstor, the modern slide library; you log in through Fondren Library. Behind the scenes in ARTstor is Shared Shelf. This is for meta data, like the artist, time period, and location.” Metcalf continued, “We tweaked the fields in Shared Shelf and fiddled with that meta data and then published those images to ARTstor and Shared Shelf Commons, or both. The Commons is free, open source, it is out there for anyone to connect to. So in our web map, our web cartographer uses an API to pull the images from the Shared Shelf Commons and brings them into the map as needed. We only use images we can geolocate.”
To geolocate the images requires researching the meta data and studying the map. “We have a painting of a fountain, and we know the fountain is located in a park. But where was the artist standing when they painted the fountain? Once you identify the perspective, you draw a little triangle starting from the point where the artist is standing. Once you geolocate the image, you click on the map and see what the artist saw, kind of like time travel.”
Historians, Archivists, and Travel Diaries
Metcalf has always loved maps. “I’m from a family of artists, and I love the visual aspect of this imagineRio project. Historians are used to working with text. Maps have all this information in them that historians have never used because the archivists don’t necessarily like bringing out their fragile documents for historians to use. Now, with digitized maps and tools like ArcMap, you can pull in layers, maybe ten different layers of the same place over time. Look at the maps one by one for a particular point. How was that point of the city changing over time?”
Travel diaries are among the previous resources that can now add new dimensions to historical study through digital mapping. Metcalf says, “I’m interested in water. Where does it come from, how does it get into the aqueduct and how does it get into the fountains, and where does it go from there? If you have a traveler who went to Rio in the 19th century, one of the common things they did is to go the top of the Corcovado, “The Hunchback” [known today as the Cristo Redentor for the statue that tops the mountain]. Travelers would describe their travels and now we can map those trips from their descriptions. One traveler actually measured the lengths of each stretch of the aqueduct.”
What is next for Metcalf? “I want to write about Rio both during the time of the king and at the turn of the turn of the twentieth century, when there was a lot of urban renewal. I’m anxious to get a description of these projects up on our web site so college-level historians can use these projects in their classes. Then I want visiting scholars to come to Rice, say for two weeks, to map their own research and to add to the imagineRio project. We (Farès and I, and Jean Aroom from Fondren Library’s GIS/Data Center, and our cartographer from England, David Heyman) presented at the International Cartography Association conference in Rio this year, and people in Rio got very excited because they instantly understood how wonderful this resource would be.”
Only at Rice
Metcalf and el-Dahdah launched into the project with no expertise in cartography or digital humanities, and at times the task seemed daunting. “But what kept us going was that it was always interesting,” recalls Metcalf. “GIS is not easy to learn, it is a complicated platform. But when I delivered a paper and it won a prize for its insights into Brazilian studies, I suddenly realized, this is interesting to other people besides us. They can see how valuable it’s going to be.”
One of the great things about teaching at Rice is the freedom to try absolutely new things. “We won a Faculty Initiative Fund grant in 2012 that really got us started.” Metcalf reflected, “To learn a new skill, to apply something outside your usual discipline, to hire students to help us with the legwork. And we’ve had a lot of students working with us on the project, all paid to work and also learn about GIS in the process! I don’t know that we could have done this project except at a place like Rice, where I [a historian] could become good friends with a professor in Architecture. Where a lab could teach you something from scratch, where librarians are so supportive. And that is the main reason this project has stayed on track and we hope will be successful.”